
You just wrapped up a massive training initiative. You spent months planning, thousands of dollars on vendors, and countless hours of employee time. Now, your boss asks the question that keeps HR directors awake at night: "Did it work?" If you can't answer with data, you're not just failing to prove value; you're risking the budget for next year.
Most organizations treat training effectiveness is the measurable impact of learning interventions on individual performance and organizational goals as an afterthought. They measure completion rates or satisfaction scores and call it a day. But finishing a course doesn't mean anyone learned anything, let alone applied it. To truly calculate effectiveness, you need to move beyond vanity metrics and dig into behavioral change and business results.
Moving Beyond the "Smile Sheet": Why Satisfaction Isn't Enough
We’ve all been there. You send out a survey right after a workshop asking, "How would you rate this session from 1 to 5?" Ninety percent of people give it a five. Does that mean the training was effective? Not necessarily. It might just mean the pizza was good, or the trainer was charming.
This is Level 1 of the Kirkpatrick Model is a four-level framework for evaluating training programs developed by Donald Kirkpatrick in 1959. While reaction data is useful for improving delivery, it tells you nothing about learning or impact. Relying solely on satisfaction scores is like judging a car’s fuel efficiency by how shiny the paint job is. You need to look under the hood.
To calculate true effectiveness, you must connect the training to actual outcomes. This requires a shift in mindset from "did they like it?" to "can they do it differently now?" and "did that difference help the business?" Without this connection, your training department remains a cost center rather than a strategic partner.
The Four Levels of Evaluation Framework
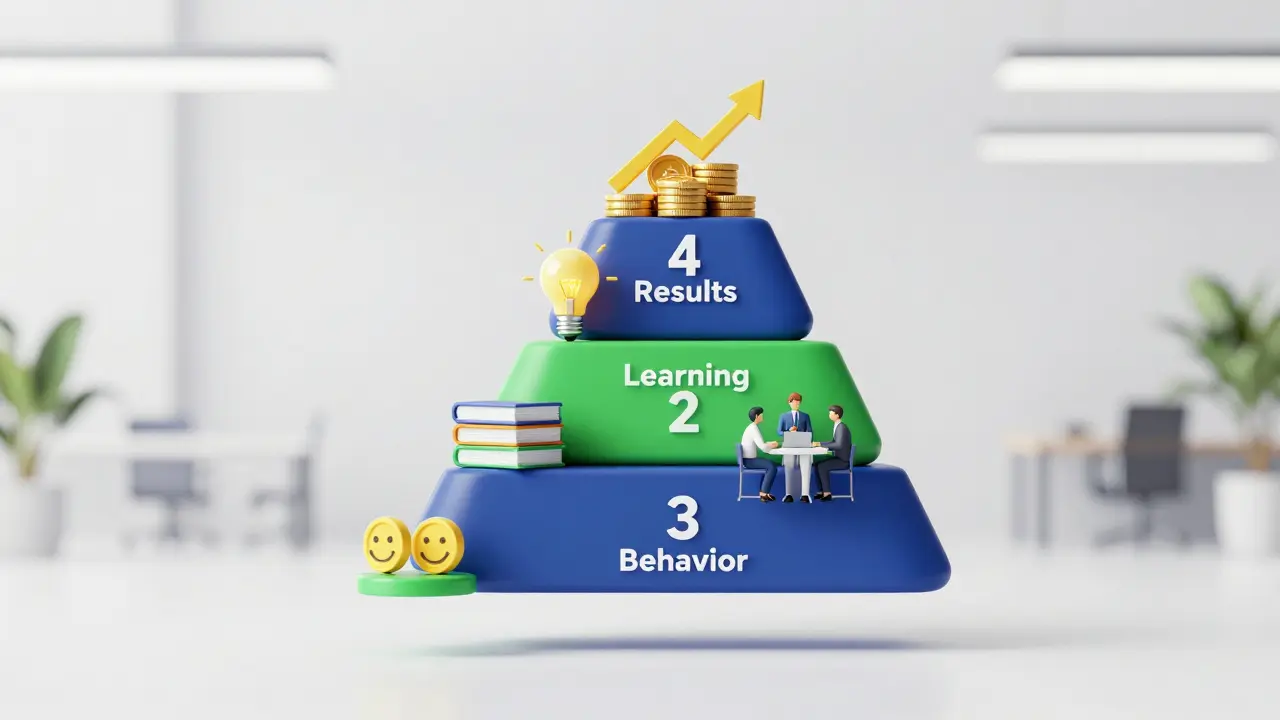
The gold standard for measuring training impact remains the Kirkpatrick Model. It breaks down evaluation into four distinct layers, each building on the previous one. Understanding these levels helps you decide where to focus your measurement efforts based on resources and goals.
- Level 1: Reaction - Did participants find the training relevant and engaging? Measured via surveys.
- Level 2: Learning - Did participants acquire the intended knowledge, skills, or attitudes? Measured via tests, simulations, or demonstrations.
- Level 3: Behavior - Are participants applying what they learned back on the job? Measured via observations, manager feedback, and performance data over time (typically 3-6 months post-training).
- Level 4: Results - Did the training achieve specific business objectives? Measured via KPIs like sales revenue, error rates, customer satisfaction scores, or production output.
Most companies stop at Level 1. Some brave souls reach Level 2. Very few consistently track Levels 3 and 4. However, if you want to calculate training effectiveness accurately, you must aim for Level 3 and 4. That is where the real value lies.
Defining Success Before You Start
You cannot measure what you have not defined. A common mistake is launching training without clear success criteria. Before you design a single slide, ask: What problem are we solving?
If the issue is low sales conversion, your metric might be the percentage increase in closed deals per rep. If the issue is high workplace accidents, your metric is the reduction in incident reports. These are SMART goals: Specific, Measurable, Achievable, Relevant, and Time-bound.
Without baseline data, you have no reference point. If you don’t know the current average handle time for customer service calls, you can’t prove that your new communication training reduced it. Collect pre-training metrics meticulously. This baseline becomes your control group against which you compare post-training performance.
Calculating Return on Investment (ROI)
When executives talk about effectiveness, they usually mean money. Calculating Return on Investment (ROI) translates training benefits into financial terms. This method, popularized by Jack Phillips (who added a fifth level to the Kirkpatrick model), allows you to compare training costs directly against monetary benefits.
The formula is straightforward:
(Monetary Benefits of Training - Cost of Training) / Cost of Training x 100 = ROI Percentage
Let’s break this down with a concrete example. Suppose you run a leadership development program for 50 managers.
- Costs: Instructor fees ($10,000), materials ($2,000), venue ($3,000), and participant salary time during training (50 managers x 2 days x $500/day = $50,000). Total Cost = $65,000.
- Benefits: Post-training analysis shows a 15% improvement in team productivity, estimated at $200,000 in additional annual revenue. However, you must isolate the effect. How much of that revenue came from the training versus market trends? A conservative estimate might attribute only 20% of the gain to the training. Attributed Benefit = $40,000.
Calculation: ($40,000 - $65,000) / $65,000 = -38%. In this scenario, the training did not pay for itself financially in the first year. This doesn't mean the training was bad-it might have improved retention or morale-but strictly speaking, the ROI is negative. Knowing this allows you to adjust the scope, reduce costs, or target higher-impact roles for future iterations.
Gathering Data: Methods and Tools
Collecting accurate data is often harder than calculating it. You need a mix of quantitative and qualitative methods.
| Method | Best For | Pros | Cons |
|---|---|---|---|
| Pre- and Post-Tests | Knowledge Acquisition (Level 2) | Objective, easy to score | Doesn't measure application |
| Performance Metrics | Business Results (Level 4) | Directly tied to business goals | Hard to isolate training impact |
| Manager Interviews | Behavior Change (Level 3) | Provides context and nuance | Subjective, time-consuming |
| Control Groups | Isolating Variables | High statistical validity | Complex to implement, ethical concerns |
Leverage your Learning Management System (LMS) for automated tracking of completions and quiz scores. For behavioral data, integrate with HRIS systems to pull performance review data. For deeper insights, conduct structured interviews with managers three months after training. Ask specific questions: "Have you seen the trainee use the new negotiation technique? Can you give me an example?"

Common Pitfalls in Measurement
Even with the best intentions, measuring training effectiveness can go wrong. Here are the most frequent traps:
- The Halo Effect: Assuming that because employees liked the trainer, they learned the material. Always separate reaction from learning.
- Attribution Error: Crediting all improvements to the training when other factors (new software, market shifts, seasonal changes) played a role. Use control groups or trend analysis to mitigate this.
- Time Lag Ignorance: Expecting behavior change immediately. Complex skills take weeks or months to embed. Measure at multiple intervals (e.g., 30, 60, 90 days).
- Data Overload: Collecting too much data and drowning in spreadsheets. Focus on 2-3 key metrics that matter most to the business.
Turning Data into Action
Calculating effectiveness is useless if you don't act on the findings. If your data shows low knowledge retention, maybe the training was too long or lacked practice exercises. If behavior isn't changing, perhaps the workplace culture doesn't support the new skills, or managers aren't reinforcing them.
Create a feedback loop. Share results with stakeholders transparently. Celebrate wins where ROI is positive. Acknowledge failures where it isn’t, and explain what you’re doing differently next time. This builds trust and positions your learning function as a driver of continuous improvement.
Remember, the goal isn't just to prove training works. It's to make training work better. By rigorously calculating effectiveness, you ensure that every dollar spent contributes to tangible growth, skill development, and competitive advantage.
How do I calculate the ROI of soft skills training?
Soft skills like leadership or communication are harder to quantify than technical skills. To calculate ROI, link behaviors to business outcomes. For example, if leadership training reduces turnover, calculate the cost savings from avoided recruitment and onboarding. If communication training improves customer satisfaction scores, estimate the revenue impact of retained customers. Use conservative attribution rates (e.g., 10-20%) to account for other influencing factors.
What is the difference between Kirkpatrick Level 3 and Level 4?
Level 3 measures behavior change-whether employees are actually using the new skills on the job. Level 4 measures business results-the impact of those behaviors on organizational goals like profit, quality, or productivity. Level 3 is about the individual; Level 4 is about the organization.
How long should I wait before measuring training effectiveness?
For simple knowledge tasks, immediate post-tests work. For behavior change, wait 30 to 90 days. Complex skills like leadership or strategic thinking may require 6 to 12 months to see full impact. Establish a timeline upfront based on the complexity of the skill being taught.
Can I use control groups for training evaluation?
Yes, control groups are one of the most scientifically valid ways to isolate training impact. One group receives training while a similar group does not. Compare their performance over time. However, this can be ethically tricky if the training is critical for safety or compliance, and it may face resistance from employees who feel left out.
What tools are best for tracking training metrics?
Start with your Learning Management System (LMS) for completion and assessment data. Integrate with HRIS for performance and turnover data. For advanced analytics, consider Learning Experience Platforms (LXPs) or dedicated analytics tools that can correlate learning activity with business KPIs. Simple spreadsheets work well for small-scale evaluations.