

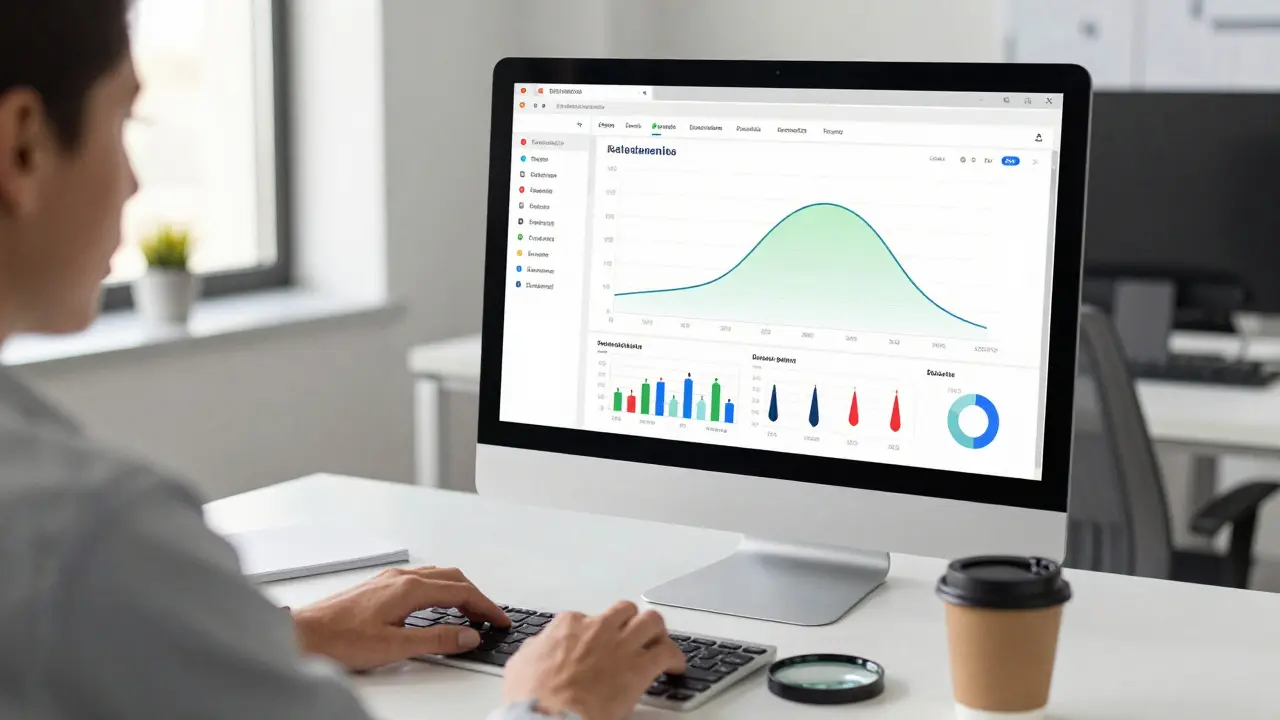
Imagine you launch a new online course with high hopes. You see a spike in enrollments the first week, but by month three, half your students have vanished. Where did they go? Why did they stop logging in? If you are just looking at total active users, you miss the story completely. That is where Cohort Analysis comes in. It is not just a fancy chart; it is the detective work that reveals why some groups of learners thrive while others drop out.
Most educational platforms suffer from "vanity metrics." They celebrate total sign-ups without understanding who stays and who leaves. By grouping students into cohorts based on shared characteristics-like start date, major, or even time zone-you can spot patterns that aggregate data hides. This approach transforms raw numbers into actionable insights for improving course design and support systems.
What Is Cohort Analysis in Education?
At its core, cohort analysis involves tracking groups of people over time. In the context of education, a cohort is a group of students who share a defining characteristic within a specific timeframe. Instead of asking, "How many students completed the course?" you ask, "Which groups of students completed the course, and when did they engage most?"
The beauty of this method lies in its ability to isolate variables. If you analyze all students together, a surge in summer enrollment might skew your retention averages. But if you separate January starters from August starters, you might discover that winter cohorts actually retain better because they face fewer distractions. This granularity allows educators and instructional designers to tailor interventions precisely.
| Cohort Type | Defining Characteristic | Best Used For |
|---|---|---|
| Time-Based Cohort | Enrollment date (e.g., Fall 2025) | Measuring seasonal trends and long-term retention |
| Behavioral Cohort | Action taken (e.g., watched video vs. skipped) | Identifying engagement drivers and friction points |
| Demographic Cohort | Age, location, or prior experience | Tailoring content for specific learner needs |
| Academic Cohort | Major, GPA, or course level | Assessing curriculum difficulty and prerequisites |
Key Metrics That Matter
To perform effective cohort analysis, you need to track the right metrics. Vanity metrics like page views often mislead. Here are the critical indicators that reveal true student health:
- Retention Rate: The percentage of students still active after a set period (e.g., Week 4). A drop here signals disengagement or confusion.
- Completion Rate: The proportion of students who finish the course. Compare this across cohorts to see which groups struggle most.
- Time-to-First-Action: How quickly does a student complete their first assignment? Faster initial engagement usually correlates with higher final completion.
- Drop-off Points: Specific lessons or weeks where activity sharply declines. These are your "leaky buckets" that need immediate attention.
- Engagement Depth: Not just logins, but meaningful interactions like forum posts, quiz attempts, or video watch time.
For example, if your "Fall 2025" cohort has a 60% retention rate at Week 2, but your "Spring 2026" cohort drops to 40%, something changed. Maybe the syllabus was updated, or perhaps external factors like holidays interfered. Without cohort segmentation, you would never notice this dip.
Identifying Student Behavior Patterns
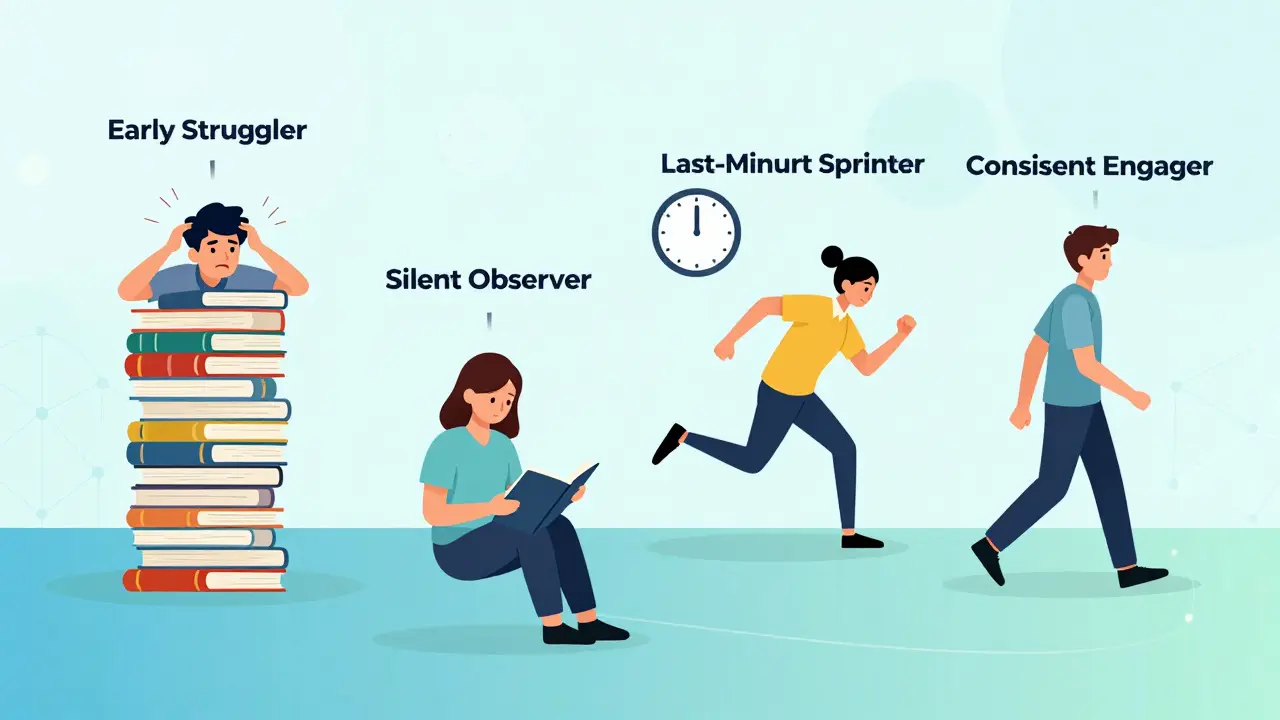
Data alone is noise until you find the pattern. Once you segment your learners, distinct behavioral archetypes emerge. Recognizing these helps you design proactive support rather than reactive fixes.
The Early Struggler: This group logs in frequently during the first week but shows declining activity afterward. Their quiz scores may be low initially. Often, these students feel overwhelmed by the pace or lack foundational knowledge. Interventions like optional review modules or peer mentoring can rescue them before they quit.
The Silent Observer: These students rarely post in forums or chat but consistently submit assignments on time. They prefer asynchronous learning and deep focus. Don't mistake silence for disengagement. Pushing them toward social activities might actually distract them. Instead, ensure their materials are clear and self-contained.
The Last-Minute Sprinter: Activity spikes only before deadlines. While they may pass, they likely retain less information and report higher stress. Analyzing this cohort’s feedback can reveal if assessments are too rigid or if pacing is off. Offering milestone check-ins can help distribute their workload more evenly.
The Consistent Engager: Regular logins, steady progress, and moderate interaction. This is your ideal baseline. Study what conditions allowed them to succeed-was it clear instructions, engaging media, or timely instructor feedback? Replicate these elements for other cohorts.
Tools for Tracking and Visualization
You do not need a PhD in data science to run cohort analysis. Several tools make this accessible for educators and administrators:
- Learning Management Systems (LMS): Platforms like Canvas, Blackboard, and Moodle have built-in analytics dashboards. Look for reports labeled "Student Progress" or "Activity Logs." Export this data to CSV for deeper analysis.
- Spreadsheet Software: Excel or Google Sheets can handle basic cohort calculations. Use pivot tables to group students by start date and calculate average grades or login frequency.
- Business Intelligence Tools: Tableau or Power BI connect directly to LMS databases. They allow dynamic filtering and interactive visualizations, making it easy to present findings to stakeholders.
- Dedicated EdTech Analytics: Services like CourseKeep or Turnitin Insights offer specialized metrics focused on academic integrity and engagement trends.
When setting up your tool, define your "day zero" clearly. Is it the day the course opens? The day the first lecture airs? Consistency is key. If you shift the starting point mid-analysis, your comparisons become invalid.
Turning Insights Into Action
Finding a problem is useless if you do not fix it. Here is how to apply cohort analysis results to improve your courses:
- Personalize Onboarding: If new students drop off in Week 1, create a mandatory orientation module. Introduce the platform, explain expectations, and build community early. A simple welcome email from the instructor can boost retention by 10-15%.
- Adjust Pacing: If a cohort struggles with Module 3, break it into smaller chunks. Add checkpoint quizzes to ensure understanding before moving forward. Consider offering flexible deadlines for complex topics.
- Targeted Support: Use automated alerts to flag students who fall behind their cohort average. Send personalized messages: "I noticed you haven’t logged in this week. Is there anything blocking your progress?" Human touch matters.
- Revise Content: If multiple cohorts show low engagement with a specific video, rewrite it. Replace text-heavy slides with interactive simulations or shorter clips. Test changes with a small pilot group before rolling out broadly.
- Incentivize Engagement: For silent observers, introduce low-stakes participation opportunities. Peer reviews or reflection journals can encourage output without pressure.
Remember, every intervention should be tested. Run an A/B test: change the onboarding process for one cohort and keep it standard for another. Compare their retention rates after four weeks. Data-driven decisions beat guesswork every time.

Common Pitfalls to Avoid
Even experienced analysts make mistakes. Watch out for these traps:
- Ignoring Small Sample Sizes: A cohort of five students is not statistically significant. Wait until you have enough data to draw reliable conclusions.
- Mixing Cohorts: Comparing part-time students with full-time professionals without adjusting for time availability leads to unfair judgments.
- Overlooking External Factors: Holidays, exams in other courses, or technical issues can cause temporary dips. Contextualize your data before blaming the curriculum.
- Focusing Only on Negatives: Celebrate successes too. Understanding why some cohorts excel helps replicate those conditions elsewhere.
Also, avoid paralysis by analysis. Do not wait for perfect data. Start with simple questions: Who is leaving? When? Why? Iterate as you learn.
Future Trends in Learning Analytics
As technology evolves, so does cohort analysis. Artificial intelligence now predicts dropout risk before it happens. Machine learning models scan historical data to identify subtle warning signs-like irregular login times or decreased forum participation-that humans might miss.
Real-time dashboards will become standard, allowing instructors to adjust teaching strategies on the fly. Imagine receiving an alert that 30% of your current cohort is stuck on a concept, prompting you to pause the lecture and clarify immediately.
Privacy regulations like GDPR and FERPA also shape how we collect and use data. Always anonymize student information and obtain consent. Transparency builds trust. Let students know how their data improves their learning experience.
How many students do I need for a valid cohort?
Aim for at least 30-50 students per cohort for statistical reliability. Smaller groups can lead to skewed results due to outliers. If your classes are smaller, combine similar cohorts (e.g., all beginner-level courses) to increase sample size.
Can I use cohort analysis for offline courses?
Yes. Track attendance, assignment submission dates, and exam scores manually or via software. The principles remain the same: group students by shared traits and monitor their progress over time.
What is the difference between retention and completion?
Retention measures ongoing engagement (e.g., still logged in after Month 1). Completion measures final achievement (e.g., finished the course). High retention does not guarantee completion, and vice versa. Both metrics provide complementary insights.
How often should I update my cohort analysis?
Review data weekly during active course periods to catch issues early. Conduct deeper quarterly analyses to assess long-term trends and curriculum effectiveness. Real-time monitoring is ideal for large-scale programs.
Is cohort analysis compliant with privacy laws?
It can be, if done correctly. Anonymize personal identifiers, aggregate data where possible, and follow institutional policies. Always inform students about data usage and obtain necessary consents to stay compliant with FERPA and GDPR.