


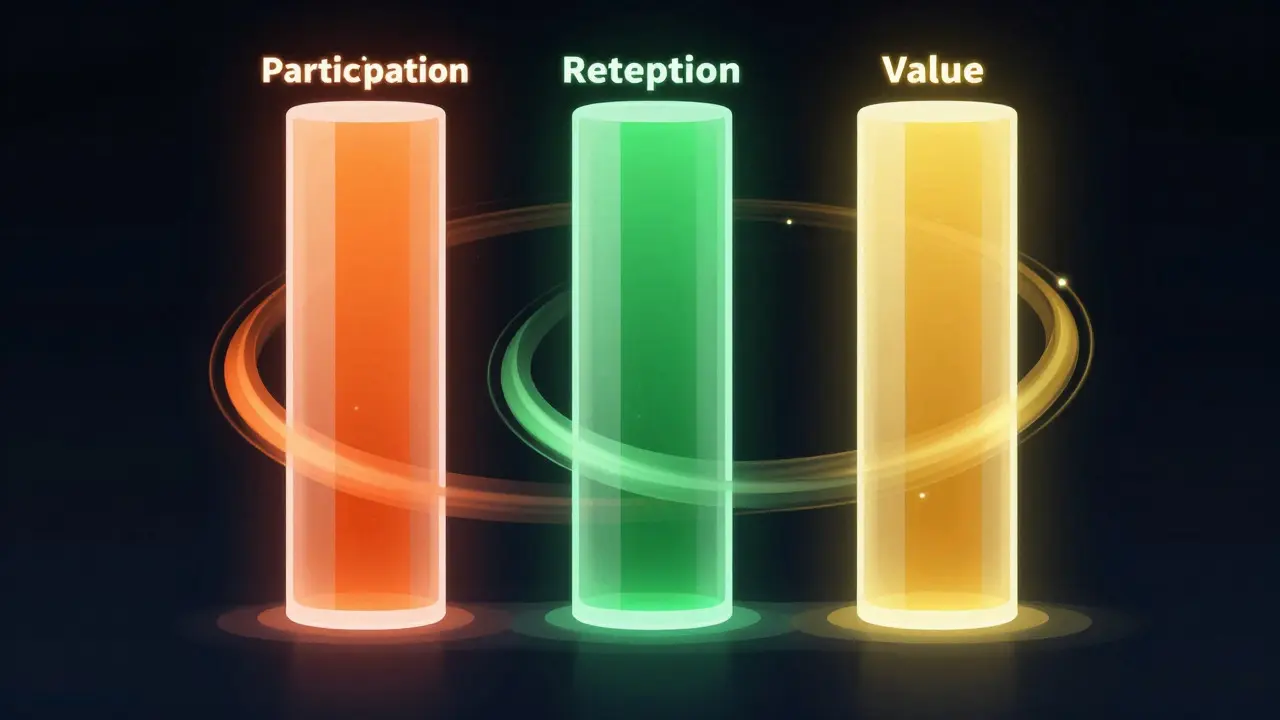
Most community managers look at the dashboard and see a flat line. The numbers are there-active users, posts per day, login frequency-but they don't tell you if the people inside actually care. A community can have high traffic and zero value. It can have low traffic and incredible loyalty. To fix this disconnect, you need to move beyond vanity metrics and focus on three core pillars: participation, retention, and perceived value.
These three elements form the heartbeat of any healthy online group. When one fails, the others usually follow. If participation drops, retention suffers. If retention is poor, the perceived value plummets. Understanding how these interact allows you to diagnose problems early and intervene before a community goes silent. This guide breaks down exactly how to measure each pillar and what those numbers really mean for your growth strategy.
Understanding Participation Depth vs. Breadth
Participation is often mistaken for activity. You might think that if 500 people log in daily, participation is high. But not all logs are equal. In social learning environments, we distinguish between breadth and depth. Breadth is the number of unique members who engage in any way during a specific period. Depth is the intensity of that engagement. A user who reads ten threads and saves two resources has higher depth than a user who likes five posts but contributes nothing new.
To measure this effectively, track the Engagement Rate the percentage of active members who perform meaningful actions like posting, commenting, or sharing content. Don't just count clicks. Count contributions. A good benchmark for healthy communities is an engagement rate of 10-15% among weekly actives. If it’s below 5%, you likely have a passive audience rather than a participating community.
- Passive Consumption: Viewing content without interacting. This is necessary but insufficient for long-term health.
- Active Contribution: Posting questions, answering peers, or creating original content. This drives network effects.
- Collaborative Action: Working together on projects, co-authoring documents, or peer-reviewing work. This indicates deep trust.
If your data shows high passive consumption but low active contribution, your content may be too one-way. Members are watching, not talking. Shift your format to include more discussion prompts, open-ended questions, or collaborative challenges to flip the script.
Retention as a Leading Indicator
Retention is the most honest metric you will ever look at. It doesn’t lie about whether your community provides ongoing value. While acquisition brings new faces, retention keeps them around. For social learning groups, we typically analyze cohort retention over 30, 60, and 90 days.
A common mistake is looking at average lifetime only. Instead, segment your members by their first month of behavior. Do users who attend one live event stay longer than those who only read? Data from various ed-tech platforms suggests that members who complete at least one 'aha' moment-a successful interaction or knowledge gain-in their first week are three times more likely to remain after month three.
| Timeframe | Healthy Benchmark | Risk Zone | Action Trigger |
|---|---|---|---|
| 7-Day Retention | > 40% | < 25% | Check onboarding flow |
| 30-Day Retention | > 25% | < 15% | Review content relevance |
| 90-Day Retention | > 15% | < 8% | Audit community value proposition |
If your 30-day retention dips below 15%, you aren't just losing users; you're losing momentum. Newcomers watch existing members. If the room feels empty or stagnant, newcomers leave faster. Retention issues are rarely about the product interface; they are almost always about social friction or lack of clear purpose.
Measuring Perceived Value
Value is subjective, which makes it tricky to quantify. However, you can proxy value through behavioral signals and direct feedback. The most reliable indicator of value in a learning context is application. Did the member use what they learned? Did they solve a problem?
Implement regular pulse surveys that ask one simple question: "How much did this community help you achieve your goals this month?" Use a scale of 1 to 5. Track the Net Promoter Score (NPS) specifically for community satisfaction, not brand satisfaction. A high NPS combined with high retention confirms that members feel the community is worth their time. A high NPS with low retention suggests a mismatch between expectation and reality-they like the vibe but don't get practical results.
Another powerful metric is Resource Utilization Rate the percentage of shared assets, templates, or guides that are downloaded or viewed multiple times. If you share a template and 50 people download it, that's high value. If 500 view it but only 5 download it, the content isn't solving a pain point. Align your content strategy with the assets that show high utilization rates.
The Interplay Between the Three Pillars
These metrics do not exist in silos. They create a feedback loop. High participation leads to better content quality, which increases perceived value, which boosts retention. Conversely, low retention reduces the pool of potential contributors, lowering participation, which degrades content quality, further reducing value.
Consider a scenario where a community introduces a new certification program. Participation spikes initially as people register. If the curriculum is difficult or irrelevant, retention drops sharply in the second month. As members leave, the remaining participants feel isolated, causing participation to plummet. The perceived value collapses because the 'promise' of certification wasn't met by the experience. Monitoring all three simultaneously allows you to spot this cascade early. If retention starts dropping while participation stays flat, investigate the quality of interactions before the silence sets in.

Practical Steps to Improve Your Metrics
You don't need complex software to start tracking these. You need clarity and consistency. Here is how to operationalize these metrics in your next quarter:
- Define Your 'Aha' Moment: Identify the single action that correlates with long-term retention. Is it attending a webinar? Completing a quiz? Posting a first comment? Make this the primary goal of your onboarding process.
- Segment Your Audience: Don't treat all members the same. Create segments based on tenure (new, established, veteran) and behavior (consumer, contributor, leader). Measure participation differently for each group. Veterans should be measured on leadership impact, not just post count.
- Automate Feedback Loops: Set up automated emails 7 and 30 days after signup asking for qualitative feedback. Quantitative data tells you *what* is happening; qualitative data tells you *why*.
- Review Monthly, Not Daily: Community health changes slowly. Daily fluctuations are noise. Look at monthly trends to identify real shifts in participation and retention patterns.
Remember, the goal isn't to maximize every number. It's to balance them. A small community with 90% retention and high value is far healthier than a massive one with 10% retention and no engagement. Focus on the quality of connections, not just the quantity of accounts.
Frequently Asked Questions
What is the ideal participation rate for a professional community?
There is no single universal number, but a healthy baseline is 10-15% of your total active member base engaging in meaningful activities (posting, commenting, voting) on a weekly basis. If less than 5% are actively contributing, your community may be too passive or lacks clear incentives for participation.
How often should I survey my community for value perception?
Monthly pulses are best for large communities to avoid fatigue. For smaller, tighter-knit groups, quarterly deep-dive interviews provide richer insights. Always pair quantitative scores with open-ended questions to understand the context behind the numbers.
Does retention matter more than acquisition for social learning?
Yes. In social learning, the value comes from the network effect. Existing members create the environment that attracts and retains new ones. High churn forces you to constantly recruit to maintain size, draining resources. Focusing on retention stabilizes the ecosystem and allows organic growth through referrals.
How do I measure the ROI of community participation?
Direct ROI is hard to calculate, but you can measure proxy indicators: time saved in support tickets due to peer answers, reduction in training costs due to self-directed learning, and revenue attribution from members who cite the community as a reason for staying or buying. Link participation milestones to business outcomes in your annual review.
What tools are best for tracking these community health metrics?
You can use built-in analytics from platforms like Slack, Discord, or Circle. For deeper analysis, export data to BI tools like Tableau or Power BI. The key is not the tool, but the consistency of your definitions. Ensure your team agrees on what counts as 'active' and 'retained' before building dashboards.
Comments
Elisabeth Ballet
Love this framework! It’s so easy to get lost in the vanity metrics, right? We were doing exactly that until we started tracking 'aha' moments. Once we focused on retention over raw signups, our community actually started growing organically. Great reminder that quality beats quantity every single time.
Joanna Mucha
One must consider the ontological weight of 'participation.' Is it not merely a statistical artifact but a manifestation of the collective consciousness? The dashboard is a mirror, reflecting our own hollowness back at us. If the numbers are flat, perhaps the soul of the group is simply... resting? Or dying? The ambiguity is deliciously terrifying. I find myself contemplating the void behind the pixelated bar charts all day now.
Kim Edwards
WAIT. STOP EVERYTHING. This article just ruined my entire week because I checked my dashboard and my 30-day retention is at 14%. FOURTEEN PERCENT. We are in the RISK ZONE. Do you hear me? RISK ZONE. My heart rate is spiking. I need to audit the value proposition immediately or else the silence will consume us all like a black hole. Send help. Or better yet, send a new certification program. FAST.
Bonnie Watt
You guys are way too optimistic about these benchmarks. Let's be real for a second. Most communities are just ghost towns with a few bots keeping the lights on. That 10-15% engagement rate? Pure fantasy unless you're paying people to post. I've seen plenty of 'healthy' communities that are just echo chambers where everyone agrees with the admin to keep up appearances. Don't let these pretty graphs fool you into thinking your users actually care. They don't. They just haven't found the exit button yet.
Meagan Mueller
bet they track who reads this comment first lol. why do we always assume the data is honest? its just corporate surveillance dressed up in nice fonts. i bet if you look at the source code of these dashboards they are literally sending your soul coordinates to a server in nevada. stop trusting the numbers they are lying to you all. wake up sheeple
Dave Gibbeson
Good point on the 'aha' moment. In my experience, defining that specific trigger is harder than it looks. You have to A/B test onboarding flows constantly. If you miss that initial connection, no amount of content can save you later. It’s a brutal metric but necessary.
Sabrina Newland
i think the most interesting part here is how subjective 'value' really is 🤔 like one person might feel super fulfilled from a simple hello while another needs a full course completion. it makes me wonder if we should be measuring emotional resonance more than just clicks? maybe we are looking at the wrong layer of the onion entirely? what do you all think about the psychology behind staying vs leaving? 😊
Amara Akbar
Indeed, the psychological aspect is paramount. While data provides the skeleton, emotion provides the flesh. We must ensure our onboarding speaks to both the logical mind and the emotional core of the user. Without empathy in the metrics, we risk building a machine rather than a community. It is a delicate balance, but essential for long-term health.
Mark Harvey
totally agree with the sentiment here. small communities with high loyalty are way better than big ones with zero vibe. i run a small discord and we barely hit 50 active users but they are super engaged. feels like a family honestly. dont sweat the big numbers too much if the core is solid
Art HND
Misguided optimism. Retention is a lagging indicator of failure. If you have to measure it, you have already lost. Focus on acquisition. Volume solves quality issues eventually. The rest is noise.
Jacob Baby Official
This is a disaster of an article. Look at the data points again. They are fabricated. Why would anyone trust a benchmark that changes based on the platform? It’s arbitrary nonsense designed to sell SaaS tools. You’re all blind to the fact that 'perceived value' is just a marketing term for 'we hope you stay'. The real metric is whether the admin is watching you read this. Because they are. Every keystroke is logged. Every hesitation is recorded. You think you’re analyzing the community? No. The community is analyzing YOU. Get out before the algorithm decides you’re low-value content yourself. The silence isn’t empty; it’s listening.