

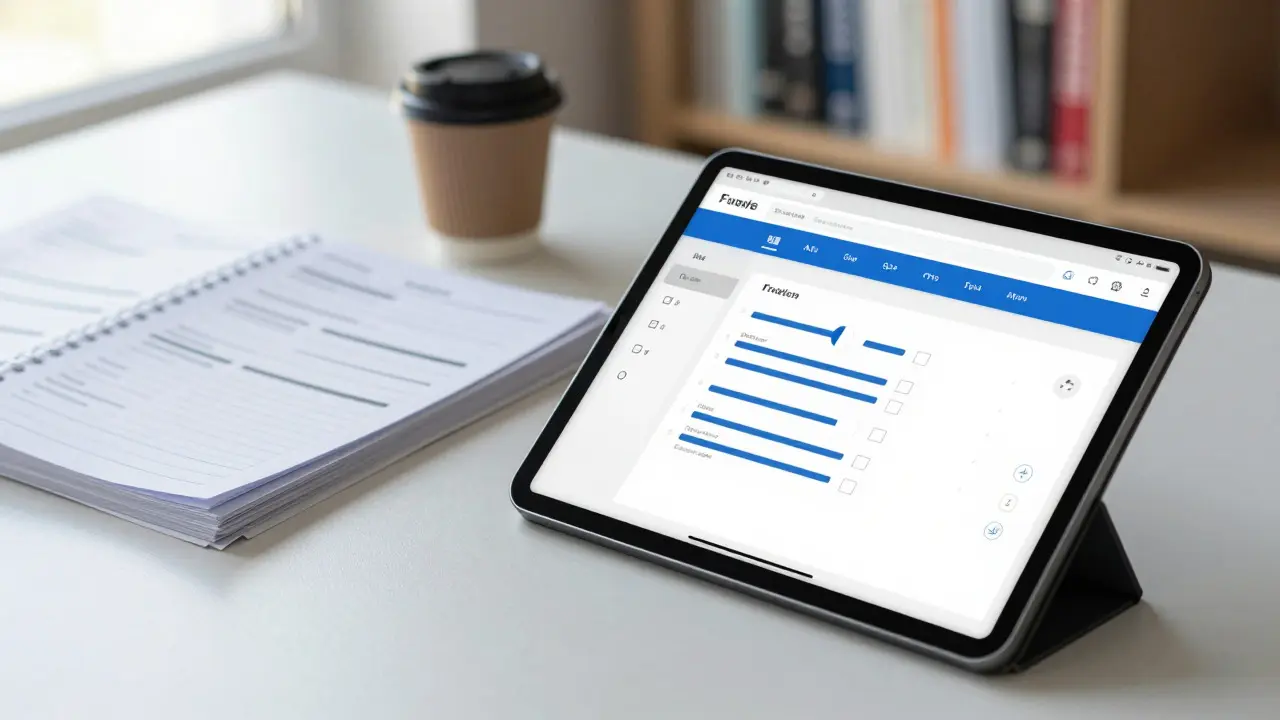
Most instructors think the hardest part of teaching is delivering content. But if you ask faculty members who have actually implemented rigorous course analytics, they’ll tell you the real challenge is getting honest data from students. You can’t improve what you don’t measure, but measuring without a solid plan often leads to noise rather than insight.
Effective student feedback collection is a systematic process of gathering qualitative and quantitative data on the learning experience to inform pedagogical changes. It isn’t just about sending out a generic form at the end of the semester. It’s about designing instruments that capture specific behaviors, perceptions, and outcomes. When done right, this process transforms vague complaints into actionable data points that directly impact curriculum development.
Why Generic Feedback Forms Fail
You’ve probably seen the standard end-of-term survey. It asks, “How was the instructor?” and “Was the material useful?” These questions are too broad. Students often default to rating their mood or their grade rather than evaluating the actual instructional design. This is where survey design comes in. Unlike casual polling, structured survey design uses validated scales and targeted prompts to reduce bias.
The goal is to separate signal from noise. If you want to know if your lecture format works, asking “Did you enjoy class?” is useless. Instead, you need to ask about engagement levels, clarity of objectives, and perceived workload balance. By narrowing the scope, you get data that correlates with actual learning outcomes, not just satisfaction scores.
Core Principles of Effective Survey Design
Before you write a single question, you need to define what you’re trying to learn. Are you looking to adjust pacing? Improve assessment methods? Or enhance accessibility? Each goal requires different metrics. Here are the foundational rules that keep your data clean:
- Align Questions with Objectives: Every question must map to a specific learning outcome or operational metric. If you don’t know why you’re asking it, cut it.
- Use Validated Scales: The Likert scale (1-5 or 1-7) is the industry standard for a reason. It allows for statistical analysis while remaining easy for students to understand. Avoid open-ended questions unless you have the time to code the responses manually.
- Minimize Cognitive Load: Keep surveys under 10 minutes. Long forms lead to straight-lining, where respondents pick the same answer for every question just to finish.
- Neutral Wording: Avoid leading language. Instead of “How helpful was the supportive instructor?”, use “How helpful was the instructor?” Leading words skew results toward positive ratings.
Timing matters just as much as wording. Mid-term check-ins are often more valuable than final evaluations because they allow for real-time adjustments. If students say the module pace is too fast in week six, you can slow down for weeks seven through ten. Final surveys only tell you how the story ended, not how to fix the middle.
Quantitative vs. Qualitative Data in Course Analytics
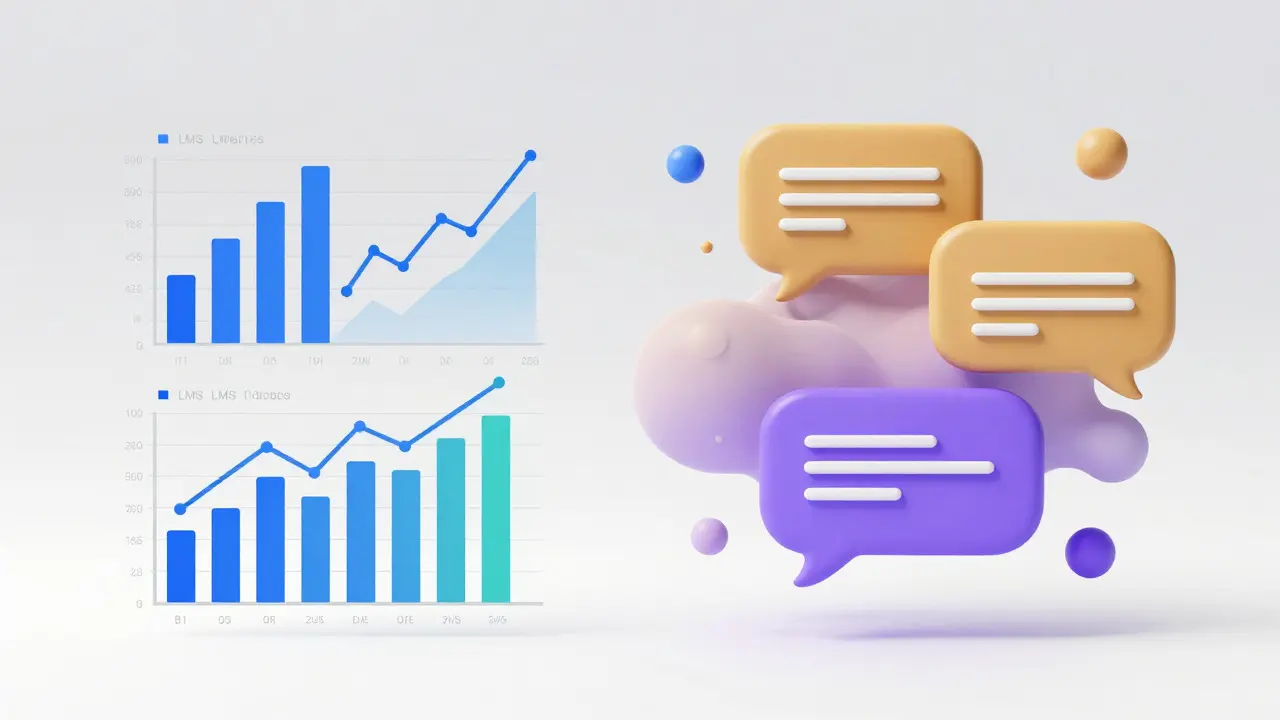
Many educators rely solely on numbers. They look at average scores and completion rates. But numbers alone don’t explain *why* something happened. This is where mixed-methods approach shines. Course analytics is the practice of using data from learning management systems and surveys to monitor and improve educational quality.
Quantitative data gives you the trend lines. For example, you might notice a drop in quiz scores in Module 3. Qualitative data provides the context. A short comment box asking “What made Module 3 difficult?” might reveal that the video resources were outdated or the terminology was confusing. Combining these two data types creates a complete picture.
| Feature | Quantitative Methods | Qualitative Methods |
|---|---|---|
| Primary Tool | Likert Scale Surveys, LMS Logs | Open-Ended Comments, Focus Groups |
| Data Type | Numerical, Categorical | Textual, Narrative |
| Best For | Tracking trends, Benchmarking | Understanding 'Why', Identifying pain points |
| Analysis Effort | Low (Automated) | High (Manual Coding Required) |
| Risk | Misses nuance | Subjectivity, Small Sample Bias |
In practice, you should use both. Use quantitative data to identify areas needing attention, then deploy qualitative probes to dig deeper. For instance, if your LMS data shows high dropout rates after Week 4, send a targeted pulse survey asking specifically about Week 4 activities.
Choosing the Right Tools and Platforms
You don’t need expensive software to gather good feedback. Most Learning Management Systems (LMS) like Canvas, Blackboard, or Moodle have built-in survey tools. However, these tools can be clunky. Dedicated platforms like Qualtrics, SurveyMonkey, or even simple Google Forms offer better flexibility and visualization features.
When selecting a tool, consider integration capabilities. Can the tool pull data directly from your LMS? If not, you’ll spend hours merging CSV files manually. Also, look for anonymity options. Students are more likely to give honest feedback if they believe their responses won’t affect their grades. Anonymity increases response rates by up to 20% in many higher education settings.
Another critical feature is conditional logic. If a student indicates they didn’t participate in the group project, you can skip the group-related questions. This keeps the survey relevant and reduces frustration.
Implementing a Feedback Loop
Gathering data is pointless if you never act on it. This is the most common failure point in student feedback collection. To create a true feedback loop, you need a closed-cycle process:
- Collect: Deploy surveys at key milestones (mid-term, post-module).
- Analyze: Look for patterns, not outliers. Calculate averages and identify significant deviations.
- Act: Make one or two specific changes based on the data. Don’t try to overhaul the entire course at once.
- Communicate: Tell students what changed and why. This builds trust and encourages future participation.
- Re-measure: Check if the change improved the metric. If not, revert or try a different approach.
For example, if mid-term feedback shows that students find the reading load too heavy, you might swap two dense academic papers for shorter case studies. Then, in the next cycle, you measure if comprehension scores or engagement metrics improved. This iterative process turns feedback from a bureaucratic hurdle into a continuous improvement engine.

Common Pitfalls to Avoid
Even well-intentioned surveys can go wrong. Watch out for these frequent mistakes:
- Confirmation Bias: Only looking for data that supports your current teaching style. Be willing to hear that your favorite method isn’t working.
- Hawthorne Effect: Students behave differently when they know they’re being observed. Regular, low-stakes checks feel less intrusive than major formal evaluations.
- Ignoring Demographics: First-year students may struggle with different things than senior students. Segment your data to see if specific groups are underserved.
- Over-Surveying: Bombarding students with weekly surveys leads to fatigue. Stick to a sustainable cadence, such as monthly pulse checks plus a comprehensive mid-term review.
Also, remember that silence is data. If response rates drop below 30%, your survey might be too long, too late, or irrelevant. Monitor participation rates as a health indicator for your feedback process itself.
Next Steps for Instructors
Ready to upgrade your course analytics? Start small. Pick one upcoming module and design a five-question survey focused on that specific topic. Use a Likert scale for three questions and one open-ended prompt. Analyze the results within 48 hours. Implement one change. Then, reflect on whether the effort was worth the insight.
As you gain confidence, expand your toolkit. Integrate LMS data with survey responses. Experiment with different question formats. The ultimate goal isn’t just to collect data, but to create a culture of responsiveness where students feel heard and instructors feel supported by evidence.
How often should I collect student feedback?
Aim for a mix of frequency and depth. Short pulse surveys every 2-4 weeks work well for tracking engagement. A more comprehensive survey at the mid-point of the term allows for significant adjustments. End-of-term surveys should be reserved for final evaluation and accreditation requirements.
What is the ideal length for a course survey?
Keep it under 10 minutes. Ideally, between 5 and 10 questions. If you need more data, split it into multiple shorter surveys distributed over time rather than one massive document. Response rates drop significantly as length increases beyond 15 minutes.
Should student feedback be anonymous?
Yes, for general course evaluation. Anonymity encourages honesty, especially regarding instructor effectiveness. However, for small classes or specific peer reviews, you might need identifiable data to follow up on individual issues, but always clarify the privacy terms beforehand.
How do I analyze open-ended comments efficiently?
Use thematic coding. Read through all responses and highlight recurring themes (e.g., "pace," "clarity," "workload"). Count the frequency of each theme. You don’t need to read every word deeply; look for patterns. Digital tools with sentiment analysis can also help categorize large volumes of text quickly.
Can I use course analytics to predict student success?
Yes, but with caution. Correlate early feedback metrics (like confusion levels or engagement scores) with final grades. If certain feedback indicators consistently precede lower grades, you can use them as early warning signs to intervene with struggling students before it’s too late.